Introduction
Entering text, values and formulas into cells is only part of creating a working model. The Insert tab allows you to add other elements such as charts, cliparts and images, among others, to your workbook. Some of these items will be explained in detail on other web pages. |

Tables
 |
Excel offers two types of tables. A table can be used to determine where your model is located. Formatting styles and other options can then be applied to the tables. A pivot table allows you to get a summary from a data list according to your criteria. |
PivotTable
 |
A pivot table allows you to quickly create a summary table from a data list or a database. You can find all the totals, averages, counts and other mathematical operations from the initial data. In addition, the dynamic aspect of the PivotTable lets you change it quickly and see the result immediately. An exercise is available to experiment with. This powerful option isn't used often enough. That's propably why Excel placed first on the Insert tab. |
![]() Follow this link to view the exercise for this command
Follow this link to view the exercise for this command
Table
A table is a section of your worksheet that contains . It's a way to create a simple database in Excel. The first line contains field names. The following rows contain the data you want to save and analyze later. You determine its size, the name of each field. |
Illustrations
 |
In addition to tables described above, Excel 2010 lets you insert graphic elements such as images, forms, charts and graphs. The next section will demonstrate how to insert these elements into your documents. |
Picture
You can insert your own pictures or photos in a document. There is also an additional tab which offers even more possibilities. |
The image may not be the size or with options you need. An additional image contextual tab appear on the Ribbon giving you more options on how the image will be presented in your document. |
Clipart
Microsoft Office offers a good library of images you can search. In addition, you can download "art" from the Microsoft Office Online site Office Online . |
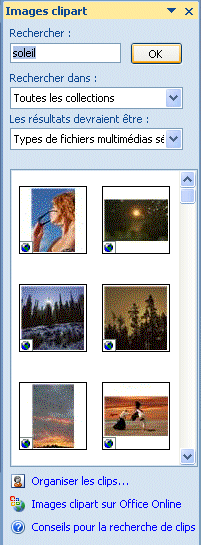 |
A task pane will appear to the right of your document. You will be able to search Microsoft ClipArt library using search words.
You can enter the type of image you need: clipart, photograph, video, music.
A series of cliparts will appear below the search box.
It will appear in your document where the cursor is located. A contextual tab will appear on the Ribbon to give you more formatting options. |
Shapes
You can create your own image, logo or design by combining simple shapes into something more elaborate. |
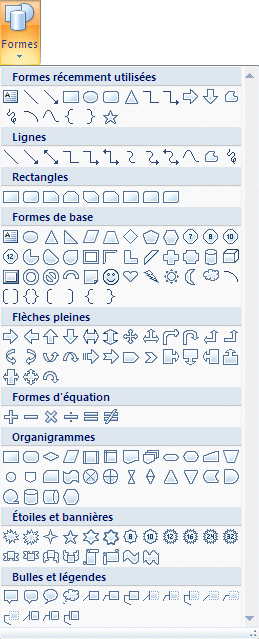 |
You can create any images by combining the shape to suit your needs.
You can create your own with a bit of practice. |

A ClipArt toolbar will appear on the Ribbon to give you more options.
SmartArt
Microsoft Office also offers several types of diagrams to suit your needs. This is one other element that has been greatly improved over previous versions. There are more diagrams which offers more options with a much improved presentation. |
![]() Place the cursor where you want to place the SmartArt.
Place the cursor where you want to place the SmartArt.
![]() Press the SmartArt command button.
Press the SmartArt command button.
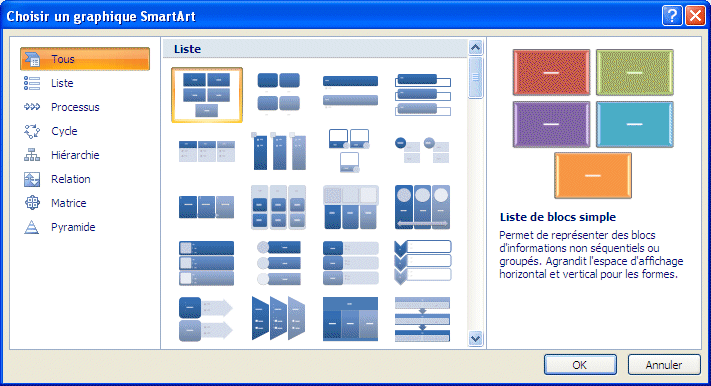
![]() Select the SmartArt diagram that best suits your needs.
Select the SmartArt diagram that best suits your needs.
![]() Press the OK button.
Press the OK button.
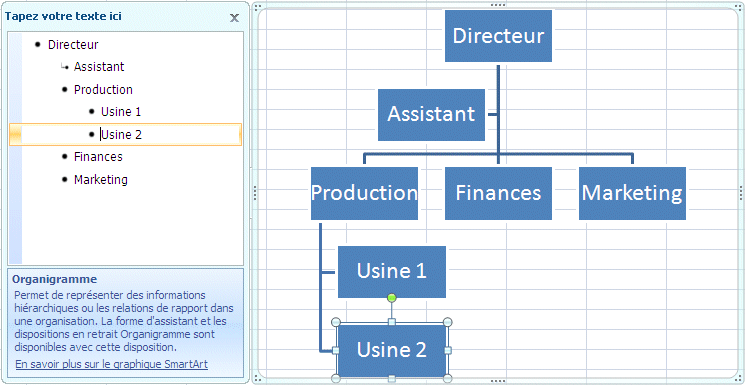
You now have a shell for your diagram. You can insert text, boxes, and change them and as you wish.
Screenshot
Before and still today, you could use the PrntScrn, or PrintScreen, key on your keyboard (next to the F12 key) to capture the screen. You only need to use the Paste option to place it in you current document. Afterward, you can edit it any way you want (crop, size, placement, colors, borders ...) Office 2010 offers a new way at capturing the screen. |
Charts
 |
Another element that has been completely redesigned is Charts. With the new Ribbon, three contextual tabs will appear to help you manage every possible options on your charts. But first, you must create one. But first, why do you need charts? You need a chart when you want to prepresent a massive amount of data. With the proper chart, it's easier to represent trends (up or down) and proportions (such as market shares). All Office 2010 applications are now using the graphics module of Excel. The module offre tellement to options qu'elles sont regroupé sous three tabs complémentaires : This module offers so many options that are grouped under three tabs complementaryWith the new Ribbon |
Column
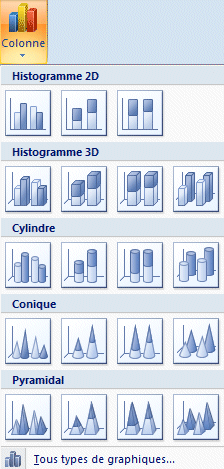 |
After a Line chart, the Bar chart is the most popular type of chart. The height of every bar represents a value. You can also use cylinders, cones or pyramids to represent the values of your chart. These can be viewed in 2D or 3D form. Even then, the Column charts can be grouped into four sub-categories. Each value can be side by side, one on top of each other for a cummulative effect or proportional. Each bar is of the same height. But the proportion of each value changes. The last category shows the each data series one behind the other. |
Line
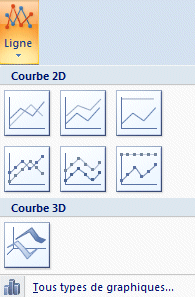 |
Line charts are the most often used type of charts. And, like the Column chart seen previously, the data series can be seen in three different ways: side by side, cummulative and proportional. You can use a strait line or place markers on every value. It makes the chart easier to read. |
Pie
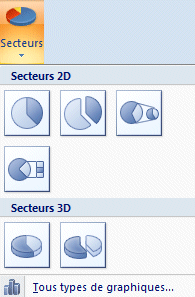 |
Pie charts are great when you want to represent shares or proportions. You can even make a sub-chart with some of the values. |
Bar
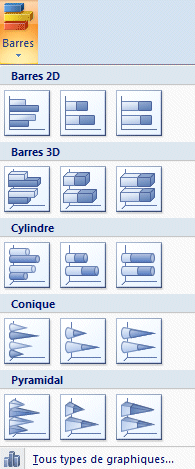 |
Like Column charts, Bar charts can represent the values by using boxes, cylinders, cones or pyramids. The big difference is that the bars are horizontal instead of vertical. Like Column and Line charts,the data series can be viewed side by side, in cummulative or proportional form. |
Area
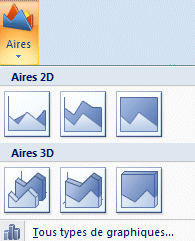 |
Area charts show how much surface a value is taking. Like the previous charts, the values can be seen side by side, one on top of the other or in proportion to each other. |
Scatter
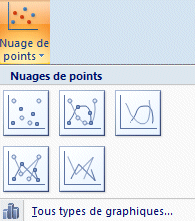 |
Scatter charts use X and Y coordinates to rpresent a value. You need two data series: one for X values and another for Y values. |
Other charts
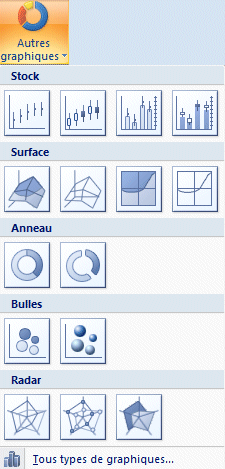 |
Microsoft Excel offers other types of charts like Stock charts, surface charts, doughnut charts, bubble charts and radar charts. |
Chart options
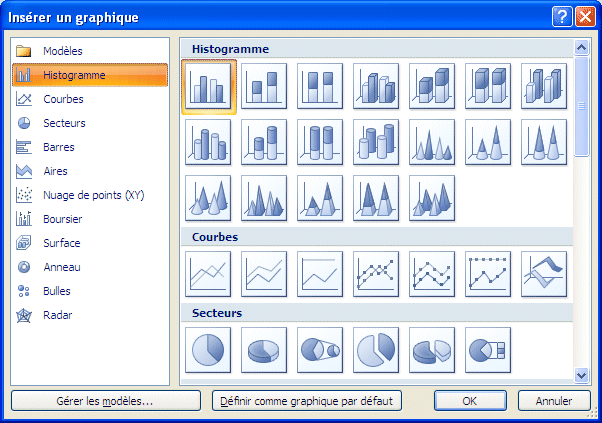 |
In the lower right corner of the Charts group of commands, you will find the Dialog box launcher |
Sparklines
 |
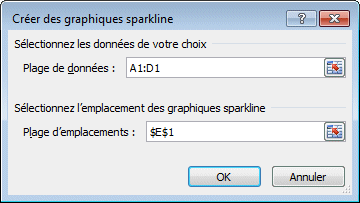
Sparklines are a new option to Excel 2010. It allows you to create a simple chart inside a cell on your worksheet. It can only use the content of a single row or column. THe are three types of sparklines: line, Column and Win/Loss. A contextual tab is available to give you more control on its formatting. |
|
|
 |
|
![]()
You can use the contextual tab to change options like the color, activate other options or even change the Sparkline type.
 |
The image to the left shows each type of Sparkline. You can try it by yourself. |
Slicers
Slicers is also a new option to Excel 2010. It's another way of of filtering data in a Pivot Table. With Excel 2013, Slicers can also be used with data tables. There are many ways to filter data in a Pivot Table. Slicers are an easy way for a novice to filter data on many fields at the same time. Once the Pivot table is created and filled with the fields and data you need, you can filter it with Slicers. They can easily "slice and dice" through your data. |
![]() From the PivotTable tools or from the Insert tab, select Slicers.
From the PivotTable tools or from the Insert tab, select Slicers.
A windows will open with the list of fields from your PivotTable or data table.
![]() Select from the list the fields you want to filter.
Select from the list the fields you want to filter.
![]() Press the OK button.
Press the OK button.
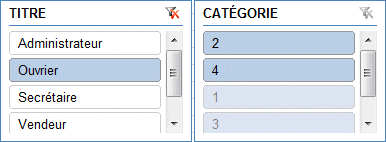 |
Each Slicer will show you a list of all the values from the fileld. You can select one or many values. If the values you want are below each other, you can select the first one, press and hold the SHIFT key and select the last value. If the values are apart from each other, press and hold the CTRL key and select as many values as you need. To remove the filter, press the |
You can change somes options, including its formatting from the Slicer contextual tab.

You can also change some of the Slicer's parameters.
![]() Click on the Slicer you want to change.
Click on the Slicer you want to change.
![]() Press the right mouse button.
Press the right mouse button.
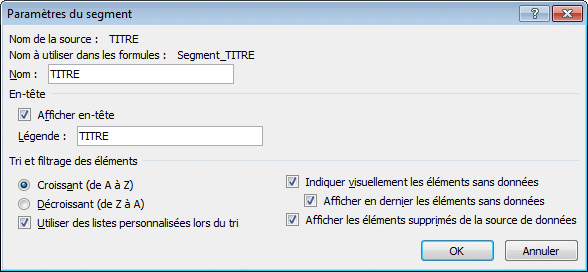
A window with the parameter for the Slicer will appear. You can change the options has you wish.
![]() Press the OK button when you're finished changing the options.
Press the OK button when you're finished changing the options.
Links
 |
Since Office 95, all Excel versions can create hyperlinks to web pages, email addresses or other Internet services or links within documents. |
Hyperlink
 |
Excel will give you four options. You can link to another Workbook or document, to a cell inside your workbook, to a new document or to an e-mail address. The Text to display box, asks you what will be written in the cell if there is no text actually in the cell.
|
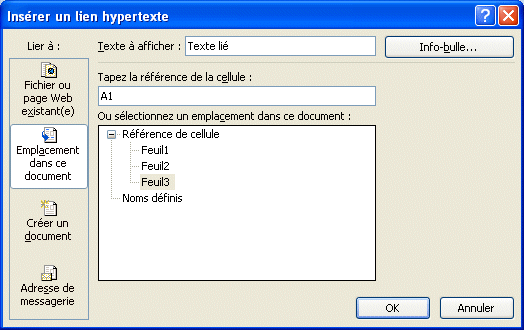 |
If you want to select an existing file, from the Look in box, select the Folder where the desired document is located followed by the file. |
 |
If you want to select a cell in the current document, select Place in this document. After, you can enter the cell address or the name you gave to a cell. |
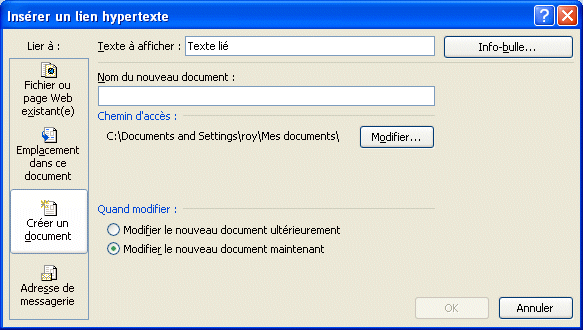 |
If you want to create a hyperlink to a new document, select Create New document. Enter the name for the new document. You can also change in what folder the new file will be saved. You can edit the new document later or start right after having pressed the OK button. |
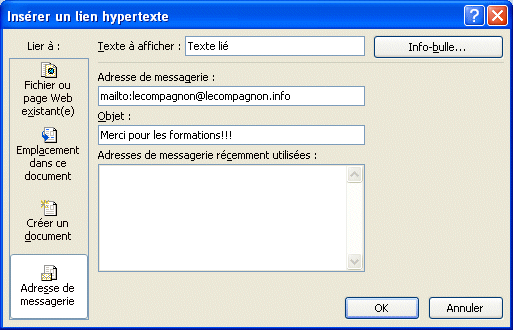 |
If you want to link to an e-maill address, select E-maill Address. Enter the e-mail address of your choice. You can also enter the subject line. |
Text
 |
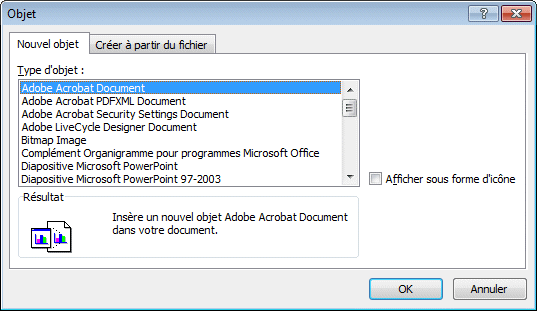
The Text group of commands allows you to add text and other objects into your workbook. You can add floating text boxes over the cells, page headers and footers, WordArt for titles, signature lines, objects, mathematical symbols and other objects. |
Text Box
This option allows you to add a textbox over a worksheet.
|
 |
A text box will appear over the worksheet. You can enter text inside it. The green ball on top of the box is a handle that allows you to rotate the box. You can hold the SHIFT key to rotate the text box at 15 degree intervals (0, 15, 30, 45...) |
Header & Footer
 |
This option allows you to insert a header and a footer for the worksheet your are working on. You will be able to show more information about the document when you will print it. You can identify the document by adding a description and even include the page number, date and time when the document was printed. Other options are also available. |
![]() Press on the Header/Footer button.
Press on the Header/Footer button.
The worksheet will change to Page Preview mode. Three boxes will appear on top and at he bottom the the page preview. The text placed in the left box will be aligned with the left margin of the page. The text in the box in the middle will be centered horizontally. The text in the right box will be aligned with the right margin of the page.
A contextual tab will appear on the right side of the Ribbon, It will allow you to add elements to the header and footer and give you more control. |

An Excel document allows you to adjust the information reserved for the header and footer of the page when printing.
WordArt
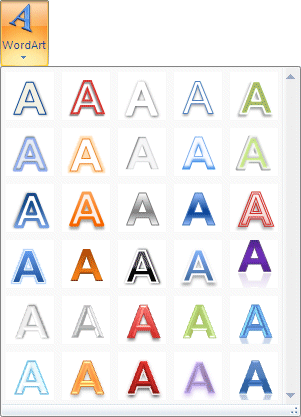 |
You can style a title or the text with one of the options of the WordArt gallery.
This can give you more artistic licence over your document's presentation. The text that you will write for WordArt will not contained in a cell. Instead, it will "float" over the worksheet. You can select the WordArt box afterward and make any chages you will need.
To change the content of the WordArt box, just click on it and make your changes. You can also move the WordArt box.
|
Signature Line
This option allows you to add an electronic signature to the document. This can be usefull for purchase order, contracts and etc...

Object
|
Symbol
A small window will appear with the most commonly used symbols.
|
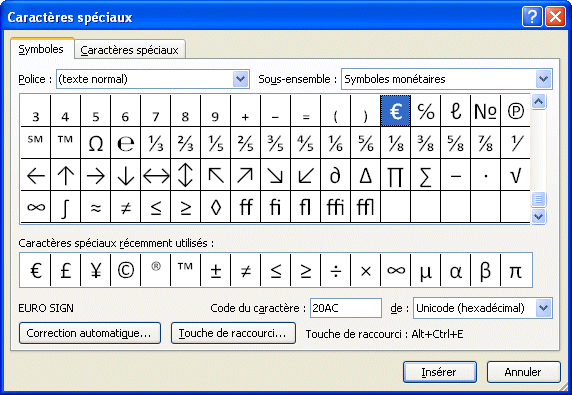
You will be able to choose from a greater list of symbols.
| You like what you read?
Share it with your friends. |


