Which proposition is more interesting for the company? In this case, we want to know which scenario will give the highest cummulative profit that is in cell D19.
|
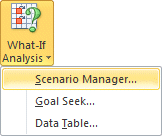
 Go to the Data tab. Go to the Data tab.
 Under the button What-If Analysis, select the Scenario Manager option. Under the button What-If Analysis, select the Scenario Manager option.
|
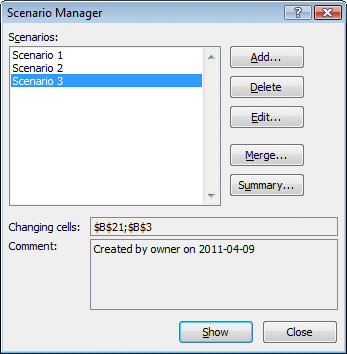 |
it's form this Scenario manager windows that you can create, change and delete scenarios. You can also merge scenarios that are located in other worksheets. The summary option will generate a new worksheet that will able you to compare the results of these scenarios on the important values in your model. The Show option allows you to view the impact of the scenario on your entire model. But don't forget to cancel this options. Or you won't be able to return to your original values. |
Adding the scenarios
 From the scenario manager window, press the Add button. From the scenario manager window, press the Add button.
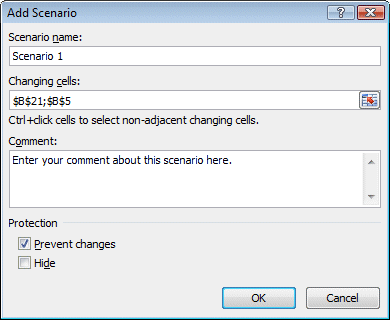 |
The first step in creating a scenario is to name the scenario and determine what are the variable cells. These are the cells you want to change the values. For the first scenario, these are the cells B21 and B5.
 In the Scenario name box, enter the text : Scenario 1. In the Scenario name box, enter the text : Scenario 1.
 In the box Changing cells, enter the cells B21; B5. In the box Changing cells, enter the cells B21; B5.
There are two ways to select multiple cells for a scenario. |
There are two ways to select multiple cells for a scenario.
 In the Changing cells box, enter each cell address, separating them with a ";". In the Changing cells box, enter each cell address, separating them with a ";".
OR
 First click in the Changing cells box. First click in the Changing cells box.
 Click the first cell you wish for the scenario. Click the first cell you wish for the scenario.
 While pressing the Ctrl key, click on other cells that you need for the scenario. While pressing the Ctrl key, click on other cells that you need for the scenario.
 Press the OK button. Press the OK button.
CAUTION : Always make sure that the cells that you select for the changing cells must be values; never formulas. Otherwise, the scenario manager will overwrite your formulas in preparation of the summary report and your model will no longer be valid.
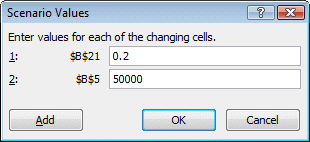
We must now enter values for each scenario. Enter the appropriate valuesfor each scenario in the boxes.
Enter the informations for the second scenario.
 In the Scenario name box, enter the text : Scenario 2. In the Scenario name box, enter the text : Scenario 2.
 In the Changing cells box, enter the cells B21; B4. In the Changing cells box, enter the cells B21; B4.
 Press the OK button. Press the OK button.
 In the B21 box, enter the value 0,3 or 30%. In the B21 box, enter the value 0,3 or 30%.
 In the B4 box, enter the value 50000. In the B4 box, enter the value 50000.
 Press the Add button. Press the Add button.
Enter the informations for the third scenario.
 In the Scenario name box, enter the text : Scenario 3. In the Scenario name box, enter the text : Scenario 3.
 In the Changing cells box, enter the cells B21; B3. In the Changing cells box, enter the cells B21; B3.
 Press the OK button. Press the OK button.
 In the B21 box, enter the value 0,4 or 40%. In the B21 box, enter the value 0,4 or 40%.
 In the B3 box, enter the value 95000. In the B3 box, enter the value 95000.
 Press the OK button. Press the OK button.
View summary table
The three scenarios have been entered. We must now generate a summary table. This table will show you a summary of the changing cells as well as the results of the cells you wanted to see.
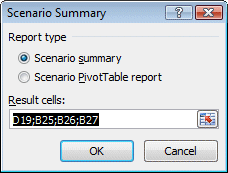
 From the Scenario manager window, press the Summary button. From the Scenario manager window, press the Summary button.
We must now determine what cells you want to see the result in the synthesis report. These cells must always be cells with formulas.
 For this exercise, select the cells D19, B25, B26 and B27. For this exercise, select the cells D19, B25, B26 and B27.
Don't forget to select the first cell, press and hold the CTRL key and then select the other cells you wish to see the results.
These cells contain the cumulative profit for the quarter (D19), the minimum (B25), the maximum (B26) and the average (B27) profit for the quarter. All the cells that you select must contain a formula.
 Make sure you choose the option Scenario summary. Make sure you choose the option Scenario summary.
 Press the OK button. Press the OK button.
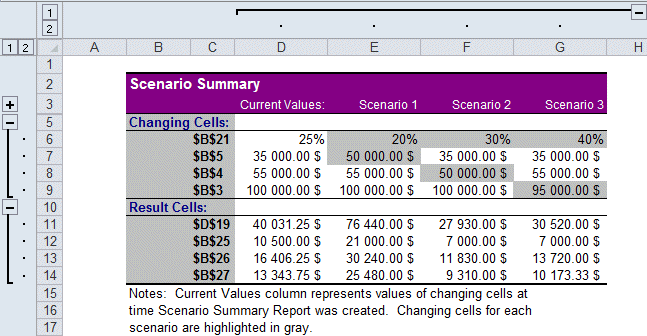
A new worksheet will be generated with the scenario results.
The table above shows the results of the scenarios. The first column shows the cells you used for the scenarios and the cells you want to see the result in synthesis. The cells in gray are those whose valuesare different from the current values in the model. The report shows that the first scenario is most profitable for the company.
There is one more thing you should know about the scenario summary worksheet. It's not dynamic. If you change the values in the scenarios, this summary will not ajust it's values. You will have to delete this worksheet and regenerate a new one with the newest values.
The Show option and it's trap
This option has the advantage of allowing you to see the impact of a scenario over your entire model. But don't forget to cancel the Show option afterward. Otherwise, you will be stuck with the values of the scenario instead of those of your model.
 Before we start, save the workbook. Before we start, save the workbook.
This is an important safety measure. You can always return to this point if you forget to cancel the scenario viewing.
 Go to Data tab. Go to Data tab.
 Under the What-If Analysis button, select Scenario Manager. Under the What-If Analysis button, select Scenario Manager.
 Select one of the available scenarios. Select one of the available scenarios.
 Press the Show button. Press the Show button.
You can navigate through your model to see the changes made by this scenario. It's important not to change numbers or to create formulas. You should just look your model as if the scenario was applied. Remember that you must cancel this view or you wont be able to return to your original data.
To cancel the scenario's view and return to your original model.
 From the Quick Access Toolbar, press the Cancel From the Quick Access Toolbar, press the Cancel  button. button.
OR
 Press on CTRL and Z. Press on CTRL and Z.
|


